 Gulfport Energy Gulfport Energy September 19, 2008 September 19, 2008 Presentation Presentation Exhibit 99.1 |
| Gulfport Energy Gulfport Energy September 19, 2008 September 19, 2008 Presentation Presentation Exhibit 99.1 |
 This presentation includes “forward-looking statements” within the meaning of Section 27A of the Securities Act of 1933, as amended (the “Securities Act”), and Section 21E of the Securities Exchange Act of 1934, as amended (the “Exchange Act”). All statements, other than statements of historical facts, included in this presentation that address activities, events or developments that Gulfport expects or anticipates will or may occur in the future, including such things as future capital expenditures (including the amount and nature thereof), business strategy and measures to implement strategy, competitive strength, goals, expansion and growth of Gulfport’s business and operations, plans, references to future success, reference to intentions as to future matters and other such matters are forward-looking statements. These statements are based on certain assumptions and analyses made by Gulfport in light of its experience and its perception of historical trends, current conditions and expected future developments as well as other factors it believes are appropriate in the circumstances. However, whether actual results and developments will conform with Gulfport’s expectations and predictions is subject to a number of risks and uncertainties, general economic, market, business or weather conditions; the opportunities (or lack thereof) that may be presented to and pursued by Gulfport; competitive actions by other oil and gas companies; changes in laws or regulations; and other factors, many of which are beyond the control of Gulfport. Information concerning these and other factors can be found in the company’s filings with the Securities and Exchange Commission, including its Forms 10-K, 10-Q and 8-K. Consequently, all of the forward-looking statements made in this presentation are qualified by these cautionary statements and there can be no assurances that the actual results or developments anticipated by Gulfport will be realized, or even if realized, that they will have the expected consequences to or effects on Gulfport, its business or operations. We have no intention, and disclaim any obligation, to update or revise any forward-looking statements, whether as a result of new information, future results or otherwise. Forward-Looking Statement Forward-Looking Statement 1 |
 Gulfport Today Gulfport Today Proved Reserves (12/31/07): 29 Million BOE Production: 2Q’08 4,886 BOED Production Mix (2Q2008): 92% Oil & NGLs 8% Gas Reserves / Production Ratio: 16 Years Enterprise Value¹: $501 Million 2 ¹ Source: Bloomberg calculated as of the close of the market on 09/15/08 at a price of
$9.72 per share using 2Q’08 shares outstanding, short- term and
long-term debt, and cash and cash equivalents from the company’s second quarter 2008 10-Q |
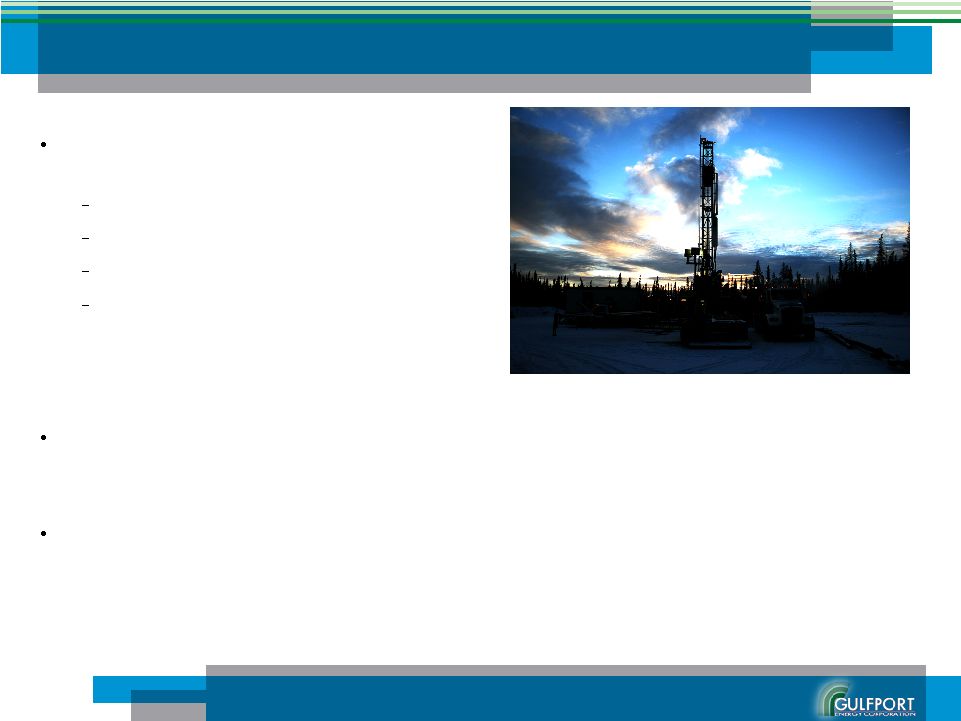
 Gulfport’s Business Strategy Defined Gulfport’s Business Strategy Defined Gulfport’s business strategy is straightforward and growth oriented: Establish an oil-focused asset portfolio with a large reserve base, apply new
technologies and pursue first mover advantages in emerging plays when
possible Build a financially conservative capital structure with low levels
of debt allowing for flexibility in pursuing acquisition opportunities as
they present themselves Today, Gulfport is positioned to prosper in the present
with significant upside potential for the future: Developed operating efficiencies in our core areas providing for a stream of free cash flow and effective growth through the drill bit Secured significant acreage positions in emerging plays among major players Provided long term growth opportunities through investing in high impact projects
Gulfport’s core competencies in the fields of geology and geophysics have helped Gulfport to secure first mover positions in a number of North America’s hottest plays 3 |
 Compelling 2Q2008 Results Compelling 2Q2008 Results Strong 2Q2008 financial performance $25.3 million of operating cash flow $26.1 million of EBITDA $14.9 million of net income available to common share $0.35 of earnings per fully diluted common share Exceeds 2Q’08 consensus estimates of $0.27 of fully diluted EPS by $0.08,
contributing to a company record in per share performance Continued production growth 2Q2008 production averaged 4,886 BOE per day 12% year-over-year growth, up 5% sequentially 4 ¹ Please refer to Gulfport’s August 7, 2008, news release regarding financial and operating results for the second quarter of 2008 for reconciliation of non-GAAP financial measures to GAAP financial measures 1 1 |
 2008
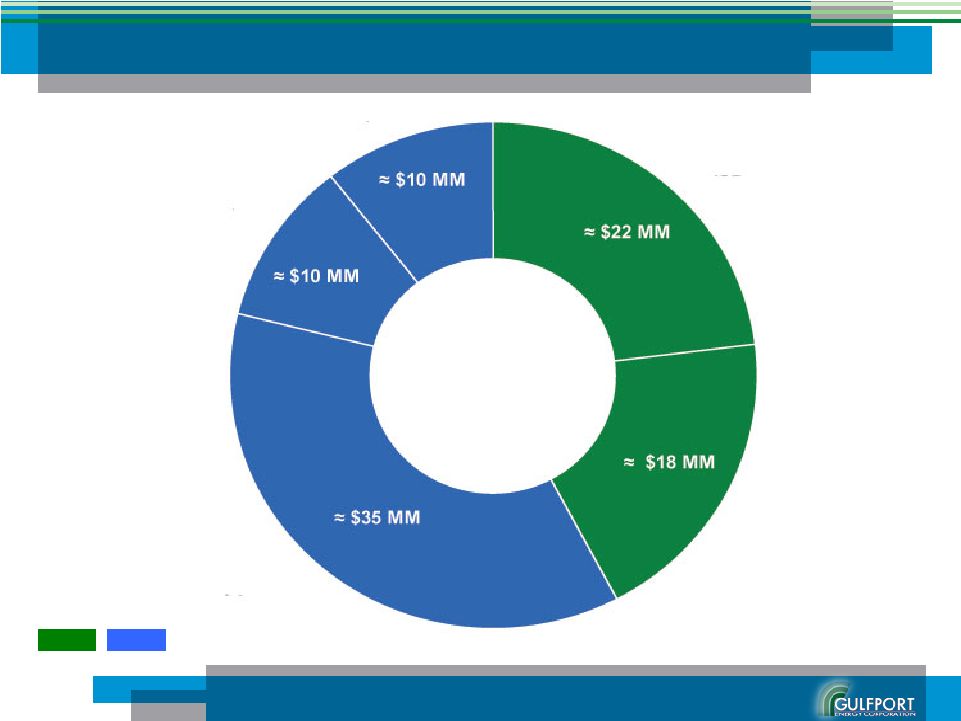
E&P Capital Forecast 2008 E&P Capital Forecast Permian Hackberry WCBB Bakken Grizzly & Other Approximately $95 MM Growth Core 5 |
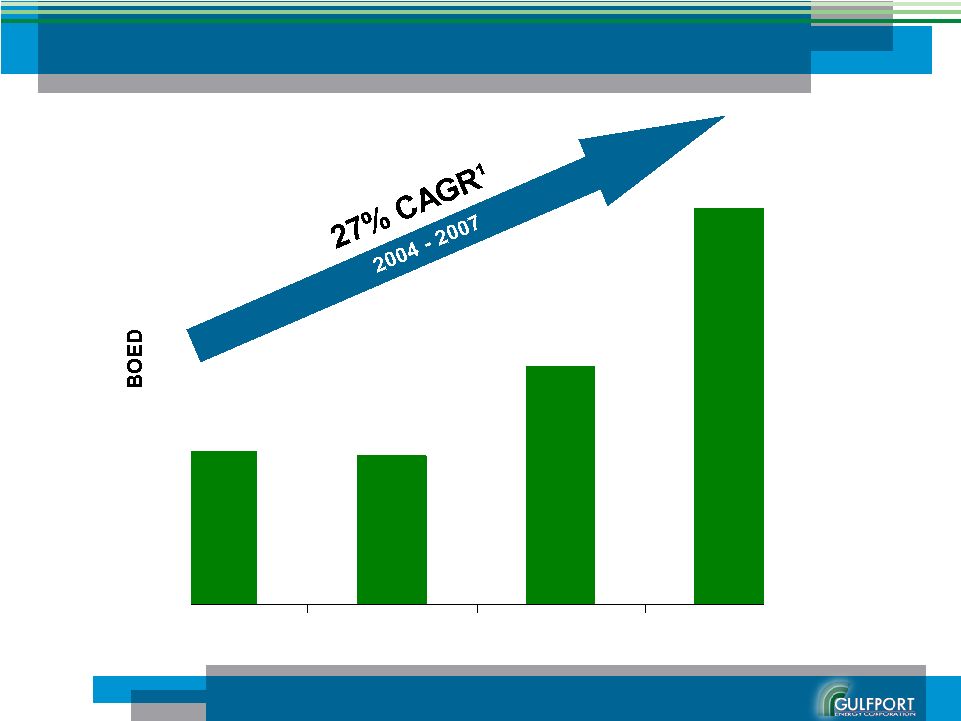 1,724 1,679 2,693 4,485 2004 2005 2006 2007 Production Growth Production Growth ¹ Compound Annual Growth Rate 6 |
 7 Operational Areas Operational Areas Southern Louisiana Acreage: 13,858 Net Acres 2007 Reserves: 22.5 MM BOE 2008 Capital Plan: Approx. $40 MM Permian Basin Acreage: 4,100 Net Acres 2007 Reserves: 6.6 MM BOE 2008 Capital Plan: Approx. $35 MM Bakken Shale Acreage: 16,511 Net Acres 2008 Capital Plan: Approx. $10 MM Canadian Oil Sands Acreage:
127,941 Net Acres OBIP:
Approx. 3 Billion Net Barrels 2008 Capital Plan: Approx. $10 MM Thailand Acreage: 4,000,000 Gross Acres 2005 Reserves: 3.5 Net BCF
Gas .
10,000 Net Bbl Oil |
 West
Cote Blanche Bay West Cote Blanche Bay Operational Statistics Operational Statistics • • Leasehold Position: Leasehold Position: 5,668 Net Acres 5,668 Net Acres • • Proved Reserves (12/31/07) : Proved Reserves (12/31/07) : 17.78 Million Net BOE 17.78 Million Net BOE • • Production: Production: – 2Q’08 3961 3961 Net Net BOED BOED • • 2008 Capital Plan: 2008 Capital Plan: $22 Million $22 Million • • 2008 Strategic Plan : 2008 Strategic Plan : • • Sustain Production Sustain Production • • Maximize Return on Capital Maximize Return on Capital 8 |
 West
Cote Blanche Bay – West Cote Blanche Bay – Operational Overview Operational Overview • Located approximately five miles off the coast of Louisiana in a shallow water bay with water depths averaging eight to ten feet – Discovery well drilled in 1940 based on a seismic and gravitational anomaly – 3-D seismic and directional drilling techniques drive the field’s development * Calculated based on December 31, 2007 reserves using December 31, 2007 pricing of $92.50 per barrel WTI oil and $6.80 per Mcf Henry Hub gas prices, adjusted for field differentials, held flat in nominal terms **Calculated based on December 31, 2007 reserves using August 6, 2008 pricing of $118.58 per barrel WTI oil and $8.69 per Mcf Henry Hub gas prices, adjusted for field differentials, held flat in nominal terms 9 • Significant salt intrusive feature, elliptical in shape, created traps in the Pliocene through middle Miocene in a series of complex, steeply dipping fault blocks – Intense faulting near and immediately above the salt stock leading to numerous compartmentalized reservoirs; less intense further away leading to larger, more continuous reservoirs $92.50 Oil $118.58 Oil Oil Gas Equiv. PV10* PV10** MMBbls Bcf MMBOE $MM $MM PDP 0.76 0.80 0.89 34.56 $ 52.42 $
PDNP 3.97 3.39 4.54 162.54 223.94 PUD 10.41 11.70 12.36 304.59 434.97 Total 15.14 15.89 17.79 501.69 $ 711.33 $ Net • At 12/31/07 Netherland Sewell had evaluated 111 booked PUDs – Anticipate drilling a total of twelve wells and recompleting 60 wells at WCBB during 2008 • There are over 100 different formations that have produced from within the field
– Within the over 850 wellbores drilled to date, over 4,000 potential zones have been penetrated December 31, 2007 Reserves • Reservoirs have high porosity and permeability with stacked pay zones averaging five to six pay zones per well bore – Substantial cumulative gross production estimated to be approximately 227 MMBOE – Deep prospective gas opportunities at WCBB • 10 Bcf Potential |
 Hackberry Hackberry Operational Statistics Operational Statistics • Leasehold Position¹: 8,190 Net Acres • Proved Reserves (12/31/07): 4.74 Million Net BOE • Production: – 2Q’08 370 Net BOED • 2008 Capital Plan: $18 Million • 2008 Strategic Plan: • Grow Production • Maximize Return on Capital 10 Lake Calcasieu ¹ Leasehold position includes an exercised state lease option to acquire an additional
3,233 acres at Hackberry |
 Hackberry – Hackberry – Operational Overview Operational Overview • Located along the western shore of Lake Calcasieu, 15 miles inland from the waters of the Gulf of Mexico – Discovered in 1926 by Gulf Oil Co. and developed
using 2-D seismic
– Our leases at West Hackberry are located within two miles of one of the United States Department of Energy’s Strategic Petroleum Reserves – During 2005 Gulfport completed a proprietary 42 square mile 3-D seismic survey at Hackberry • Major salt intrusive feature, elliptical in shape, divided into east and west entities by
a saddle – A series of structurally complex and steeply dipping fault blocks formed by the salt
intrusion serve to trap hydrocarbon accumulations – Multiple pay zones and highly productive sands in the deep and shallow sections on the
north flank of the field • Wells currently produce from perforations found between 5,100’ and 12,200’ – Development Potential of over 30 different pay zones 11 • Impressive cumulative production – Over 79 MMBOE has been produced to date from the Hackberry fields • 13 drilling locations approved $92.50 Oil $118.58 Oil Oil Gas Equiv. PV10* PV10** MMBbls Bcf MMBOE $MM $MM PDP 0.410 0.414 0.479 16.33 $ 23.80 $
PDNP 0.631 0.663 0.742 36.74 47.83 PUD 3.236 1.699 3.519 120.26 180.34 Total 4.277 2.776 4.740 173.33 $ 251.97 $ Net December 31, 2007 Reserves * Calculated based on December 31, 2007 reserves using December 31, 2007 pricing of $92.50 per barrel WTI oil and $6.80 per Mcf Henry Hub gas prices, adjusted for field differentials, held flat in nominal terms **Calculated based on December 31, 2007 reserves using August 6, 2008 pricing of $118.58 per barrel WTI oil and $8.69 per Mcf Henry Hub gas prices, adjusted for field differentials, held flat in nominal terms |
 Southern Louisiana – Southern Louisiana – What’s New What’s New 12 Production from Southern Louisiana averaged 4,336 net BOE per day for 2Q2008, an increase
of 315 net BOE per day from the 1Q2008 average of 4,021 net BOE per day
- July Production from Southern Louisiana averaged 4,277 net BOE per day - Production increased to an average of 4,939 net BOE per day for the first 29 days of
August prior to being shut-in in preparation for Hurricane Gustav
- Gulfport deployed personnel to the fields shortly after Gustav; however, full
production was not restored before the fields were shut-in in
preparation for Hurricane Ike - As announced on September 15, 2008 Gulfport has deployed personnel back to its Southern
Louisiana properties and is in the process of completing full physical
assessments of the fields and facilities. The company intends to restore production as soon as possible although an anticipated date cannot be determined until a full
assessment is complete. West Cote Blanche Bay Brought a rig back to WCBB early - Rig returned on July 2 to begin drilling a ten well program
Despite the fact that GPOR did not drill at West Cote for most of the first half of
the year, we were able to maintain production through increased operational
efficiencies and the normal cycle of up-hole recompletion Hackberry
Spudded the first of four wells at Hackberry on May 5 - Pleased to report all four appear to be productive nd th |
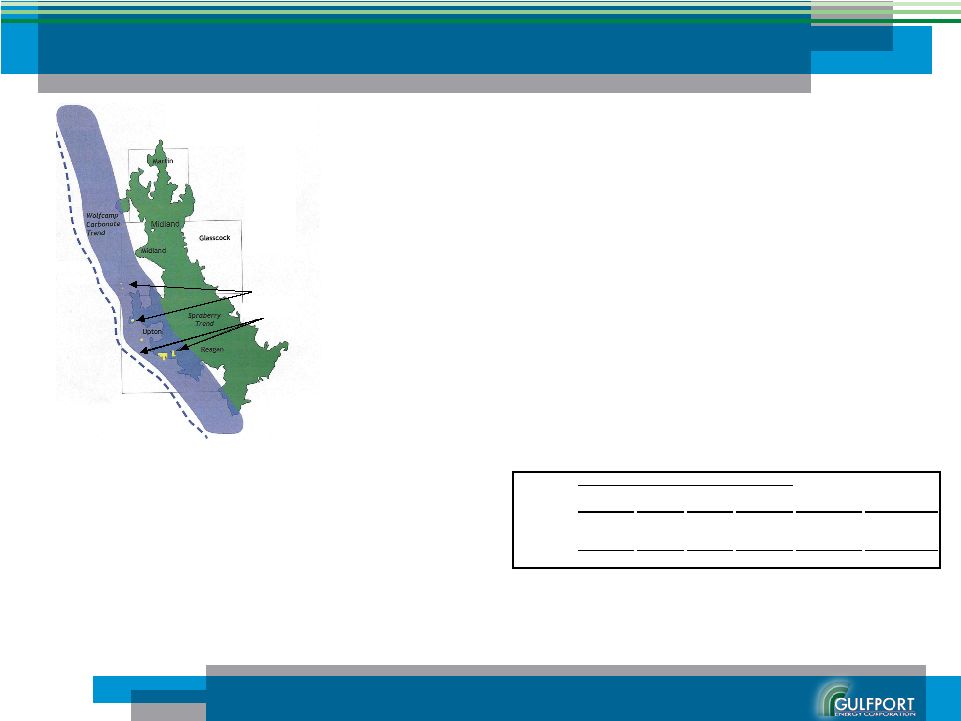
 Permian Basin Permian Basin Operational Statistics • Leasehold Position: 4,100 Net Acres • Proved Reserves (12/31/07): 6.63 Million Net BOE • Production: – 2Q’08 479 Net BOED • 2008 Capital Plan: $35 Million • 2008 Strategic Plan : • Grow production through the drill bit by actively drilling on 40-acre spacing • Evaluate potential for 20-acre down spacing 13 |
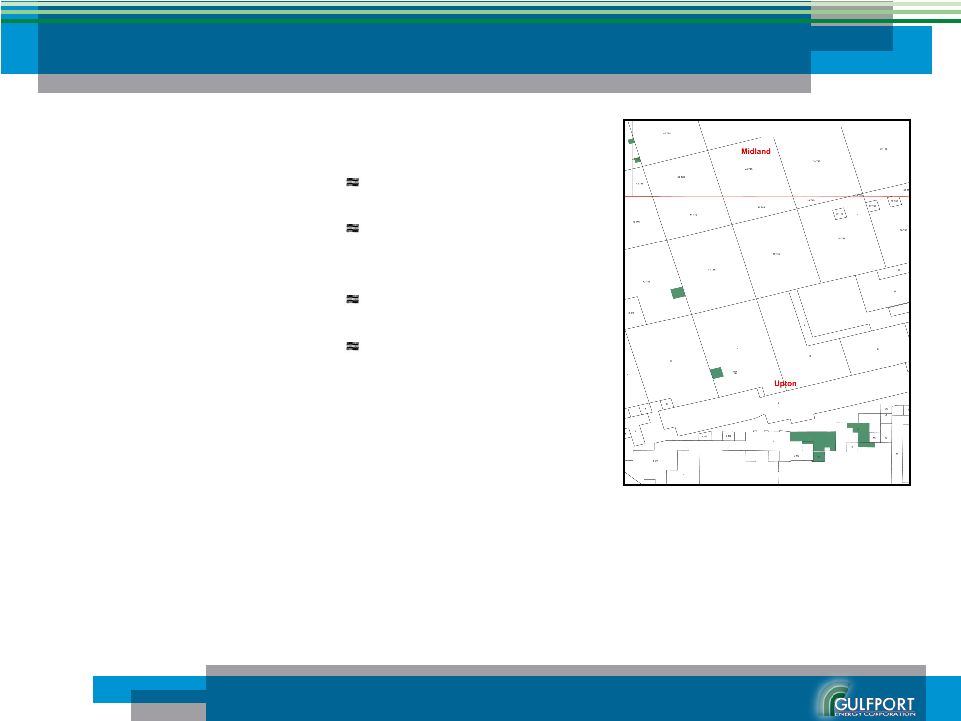
 GPOR
Acreage Permian Basin – Permian Basin – Operational Overview Operational Overview 14 • Potential for down spacing to 20-acre units – 40-acre spacing only recovers 3% of original oil in place – Down spacing would yield an additional 200+ gross well locations $92.50 Oil $118.58 Oil Oil Gas NGL Equiv. PV10* PV10** MMBbls Bcf MMBbls MMBOE $MM $MM PDP 0.710 1.243 0.381 1.298 33.73 $ 48.19 $
PDNP 0.184 0.232 0.068 0.291 10.59 15.14 PUD 3.135 4.112 1.221 5.041 101.67 168.10 Total 4.029 5.587 1.670 6.630 145.99 $ 231.43 $ Net • Proved reserves are estimated at approx. 6.6 million barrels net to Gulfport as of 12/31/07 • Gulfport’s exposure to the Permian began in December 2007 with the acquisition of 4,100 net acres (50% interest in 8,200 gross acres) – The deal included 32 gross producing locations and 178 gross additional offset
locations at 40-acre spacing • Located in West Texas, the Permian Basin is considered to be one of the major producing basins in the United States – Target productive zones in the long-established Wolfcamp play, also picking up zones in the shallower Sprayberry formation • Expect to drill 17 to 22 net wells in 2008 with production additions being backend loaded • Recent advancements in well fracturing technology drive the field’s development – The application of new developments in high volume fracs generate compelling well economics December 31, 2007 Reserves * Calculated based on December 31, 2007 reserves using December 31, 2007 pricing of $92.50 per barrel WTI oil and $6.80 per Mcf Henry Hub gas prices, adjusted for field differentials, held flat in nominal terms **Calculated based on December 31, 2007 reserves using August 6, 2008 pricing of $118.58 per barrel WTI oil and $8.69 per Mcf Henry Hub gas prices, adjusted for field differentials, held flat in nominal terms |
 Permian Basin – Permian Basin – What’s New What’s New 15 As of September 15, 2008, a total of 27 gross wells had spudded on our acreage year-to-date Of these, 15 wells have been completed and 4 have reached peak production New wells are behaving as expected with a three to four month flow back to peak
production after being fractured 2Q2008 production of 479 BOE net to Gulfport Gross drill and complete costs for a typical well are approximately $1.8 MM Field development continues at 40-acre spacing, however, down spacing to
20-acres on the horizon Based on internal estimates, 40-acre spacing recovers only 3% of total oil in
place. Currently employing drilling pattern to facilitate efficient down
spacing to 20-acres. |
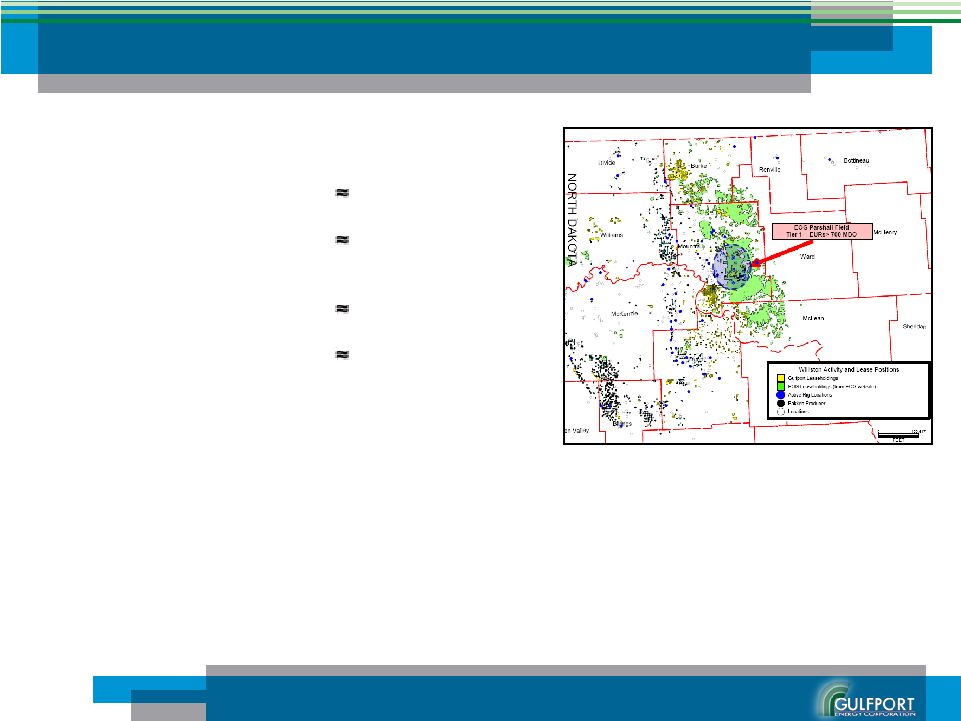 Bakken Shale Bakken Shale Operational Statistics • Leasehold Position: 16,511 Net Acres • Proved Reserves (12/31/07): 81,000 Net BOE • Production: – 2Q’08 71 Net BOED • 2008 Capital Plan: $10 Million • 2008 Strategic Plan : • Actively pursue new leasing opportunities • Develop acreage by participating in drilling activity 16 |
 Bakken Shale – Bakken Shale – Operational Overview Operational Overview • Located in Montana, North Dakota, South Dakota and Saskatchewan, the Bakken formation covers over 200,000 square miles of the subsurface of the Williston Basin – In April 2008, the USGS released a report estimating there to be 3.0 to 4.3 billion barrels of undiscovered, technically recoverable oil in the Bakken
formation 17 • Based upon the identified geologic trends, Gulfport
began actively pursuing
acreage in the play, effectively achieving first mover advantages • Until recently, lower than average porosity and permeability have hindered
field development – However, extensive vertical faulting combined with the application of
horizontal drilling techniques and advancements in fracturing
technology have helped transform the tight shale play into one of the hottest oil plays in N. America • For 2008, Gulfport estimates that its capital spending in the Bakken
will total approximately $8 to $10 million, the equivalent
of approximately 1.5 net wells – As of June 30th , 2008, Gulfport had secured 16,511 net acres in the play Three Forks Fault Parshall |
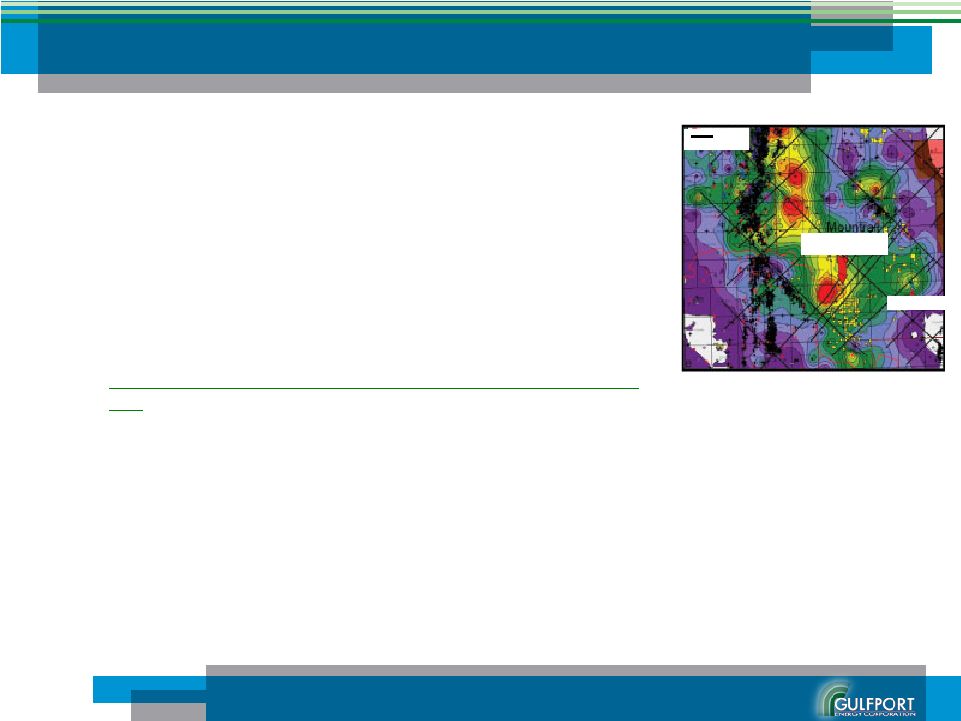
 Bakken Shale – Bakken Shale – What’s New What’s New 18 The Windsor operated Whitmore 1-6H, of which GPOR owns an approximate 16% working
interest, underwent a multistage frac in late August This well is located in the Parshall field, approximately 3 to 5 miles from two EOG wells which have reported peak production rates of 3,744 and 3,255 barrels of oil per day. The second Windsor operated well, the Whitmore 1-7H, has reached total depth and is
scheduled to be fracture treated in the upcoming weeks Excitement surrounding the play continues to build Currently GPOR is most active in EOG’s Parshall area where a number of wells, some in which Gulfport has participated, have reported initial production rates between 2000 and 3000+ BOE per day Gulfport’s current acreage position has been expanded from approximately 14,000 as
reported at the end of the first quarter to 16,500 net acres, and we intend to
continue to actively lease in the area As of September 15, 2008 we are participating in, or had elected to participate in, 41 wells for 2008 Drilling and completion costs have been in line with AFE’s of around $6 million per well depending on the completion and frac techniques Meanwhile, average EUR’s have been steadily increasing throughout the play With approximately 16,500 net acres, GPOR has a drilling inventory in some of North
America’s hottest acreage |
 Canadian Oil Sands Canadian Oil Sands Operational Statistics Operational Statistics • Leasehold Position: 127,941 Net Acres • OBIP¹ (09/30/07): 3 Billion Net Bbls • 2008 Capital Plan: $10 Million • 2008 Strategic Plan : • Continue core hole drilling program to delineate acreage • Develop Algar Lake Project with the goal of first oil in 2011 ¹Original-Bitumen-In-Place: Total bitumen in place over an area of
152,564 acres for sand greater than 10 meters of thickness 19
|
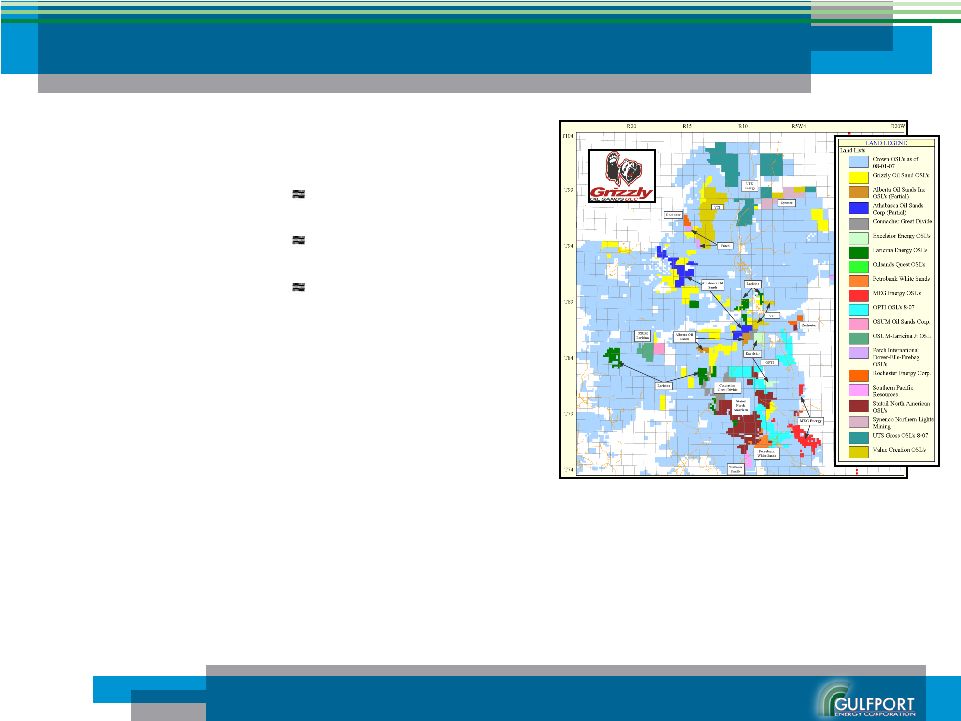
 Canadian Oil Sands – Canadian Oil Sands – Operational Overview Operational Overview The Canadian Oil Sands rivals Saudi Arabia as the largest oil play in the world
with 315 billion barrels of estimated recoverable resources - The oil sands are deposits of bitumen, a molasses-like viscous oil that will not
flow unless heated or diluted with lighter hydrocarbons The vast majority of Grizzly’s acreage was acquired by the summer of 2007, by
which time virtually all prospective acreage had been leased 20 Since making the strategic decision to invest in oil sands acreage, Gulfport has
acquired the largest acreage position of any US independent producer through its
participation in Grizzly Oil Sands ULC - Devon is the next closest with 75,000 acres Grizzly is developing a section of acreage known as Algar Lake with the intent of employing a method of in-situ extraction called Steam Assisted Gravity Drainage (SAGD) to produce the leasehold - First production estimated for the second half of 2011 with 2,500 barrel per day of net
production on an estimated facility and well pair capital expenditure of
$90 million net to Gulfport Potential for 3.65 million barrels per year, with
approximately 900,000 barrels net to Gulfport Resource potential of
approximately 100 million barrels per facility, with approximately 25 million barrels net to Gulfport Following the 2006 and 2007 winter drilling seasons, third party engineers DeGolyer & McNaughten issued a report estimating total bitumen in place for seven Grizzly properties as 11.9 billion barrels over an area of 152,564 acres for sand greater than 10 meters of thickness Alberta’s highly prospective oil sands land base is now essentially leased up and
Grizzly is positioned to take advantage of the lease supply shortfall
- Given that many of the leases offset viable projects, Grizzly’s
non-concentrated land base increases the likelihood of multiple significant farm out and land swap opportunities Various Grizzly leases directly offset: Nexen/OPTI, ConocoPhillips, Imperial
Oil/Petro-Canada, Encana, JACOS, Statoil, Chevron/Shell/Marathon, Value
Creation, Athabasca Oil Sands & Laricina |
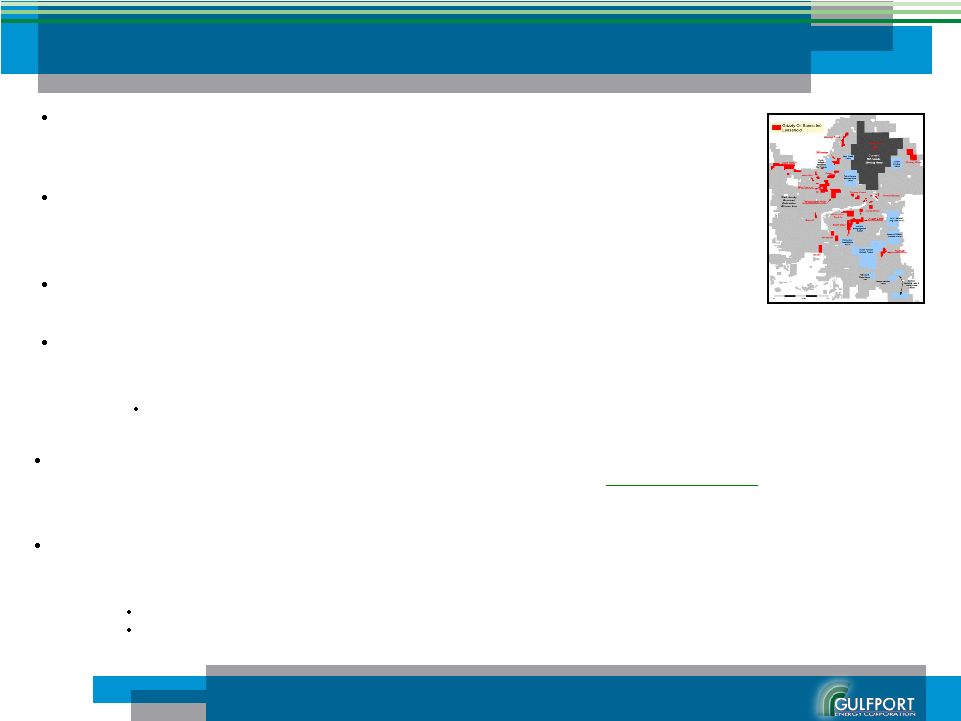
 Canadian Oil Sands – Canadian Oil Sands – What’s New What’s New 21 Drilled 55 core holes during 2007-2008 winter drilling program 28 core holes at Algar Lake 12 core holes at Silvertip 10 core holes at Birchwood 5 core holes at Thickwood Hills Shot 7.5 square mile seismic survey at Algar Lake Progress continues to be made on Grizzly’s regulatory application for a SAGD
facility at Algar Lake |
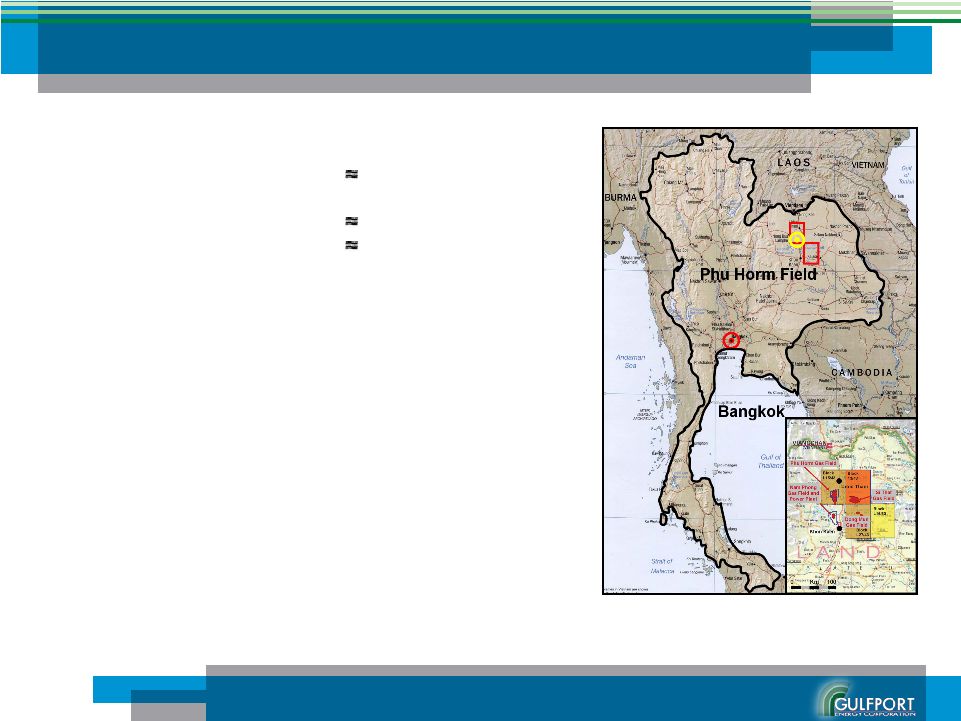 Thailand Thailand Operational Statistics Operational Statistics • Leasehold Position: 4 Million¹ Gross Acres • Net Proved Reserves (1/1/05): 3.6 Net BCF of Gas 10,000 Net BBL of Oil • 2008 Strategic Plan : – Expand project, applying project cash flow to offset capital outlays – Shoot 3-D seismic survey in the fourth quarter of 2008 22 ¹Gulfport owns a 2% indirect interest in APICO, LLC, an international oil and gas exploration company. APICO owns a 35% interest the Phu Horm gas field operated by Hess Corporation, a 100% of concession blocks L15/43 and 27/43, and a 60% of concession block L13/48. The APICO holdings total approximately 3 million acres. During the first quarter of 2008, Gulfport purchased a 5% interest in Tatex Thailand III, LLC, the owner of concession block L16/50. |
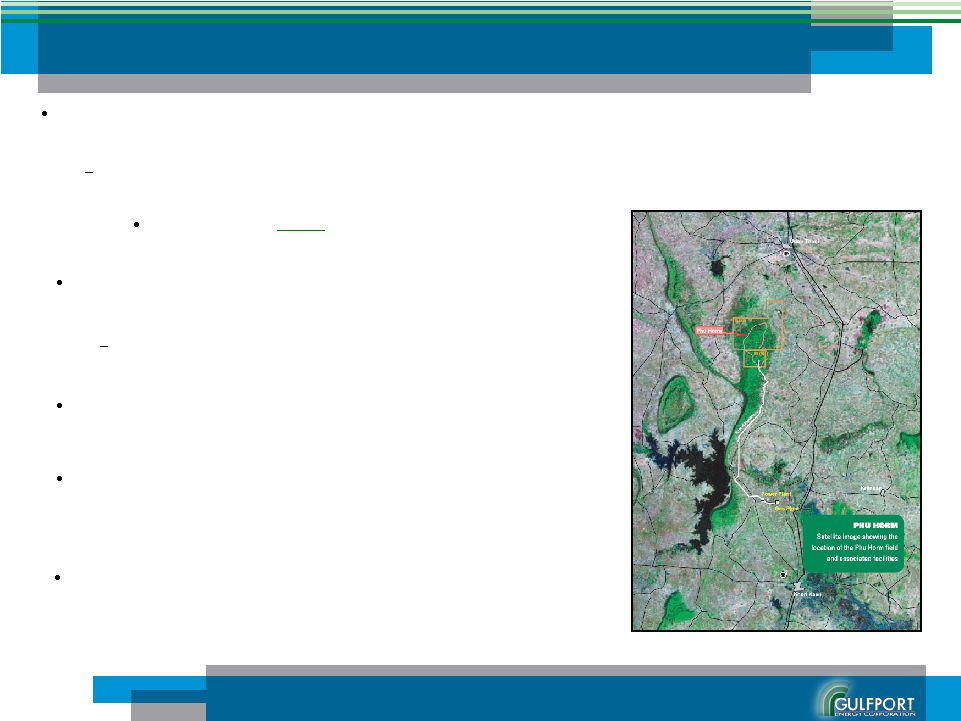 Thailand – Thailand – Operational Overview Operational Overview Through an indirect equity investment in APICO, Gulfport has leveraged significant
exposure to a natural gas play of immense magnitude in northeast Thailand Third party engineers Gaffney Cline credit wells producing in the Phu Horm gas field with approximately ½ TCF¹ of reserves 3P Reserves of 9 TCF provide substantial exploratory upside Production net to Gulfport at year-end 2007 totaled approximately 100 Mcf per day. Cash flow from the project is expected to offset capital outlays Significant upside provided by the exploratory potential of four concession blocks totaling approximately 4 million acres 23 ¹ Third party report issued on 01/01/05 Plans are in place to shoot a 3-D seismic survey of Block L16/50 in the fourth quarter of 2008 APICO has identified several high-quality exploration targets |
 Gulfport Financial Highlights Gulfport Financial Highlights Enterprise value of $501.2¹ million $414.26² million equity value, $89.1³ million debt, $2.2³ million working capital deficit Expect strong performance in 2008 EBITDA estimated to be from $110 million to $120 million for YE2008 Compelling statistics 4.7x EBITDA and 8.38 P/E Ratio Trading at a discount to NAV PV-10 of $821 million for YE2007 based upon price deck of $92.50 WTI oil and $6.80
HH gas before adjustments Reserves attributable to the Bakken, Canadian Oil Sands, and Thailand are not reflected in the PV-10 figure provided by the YE2007 reserve report ¹ Source: Bloomberg calculated as of the 09/15/08 close price of $9.72 and 2Q’08
10-Q ² Calculated as of the 09/15/08 close price of $9.72 ³ Source: 2Q’08 10-Q Financial Statements 4 Source: Bloomberg calculated as of the 09/15/08 close price of $9.72 24 4 |
 Fixed Price Contracts to Secure Cash Flow Fixed Price Contracts to Secure Cash Flow Oil Fixed Price Contracts Barrels per Day Avg. Daily Price 3Q2008 3500 $86.43 4Q2008 3500 $86.60 3Q-4Q 2008 Total 3500 $86.52 2009 Total 3000 $89.06 Month Weighted Average Daily Price Barrels Per Day July-08 $85.89 3500 August-08 $86.81 3500 September-08 $86.60 3500 October-08 $86.60 3500 November-08 $86.60 3500 December-08 $86.60 3500 Gulfport Energy Corporation Fixed Price Contracts 2H2008 Month Weighted Average Daily Price Barrels Per Day January-09 $89.06 3000 February-09 $89.06 3000 March-09 $89.06 3000 April-09 $89.06 3000 May-09 $89.06 3000 June-09 $89.06 3000 July-09 $89.06 3000 August-09 $89.06 3000 September-09 $89.06 3000 October-09 $89.06 3000 November-09 $89.06 3000 December-09 $89.06 3000 Gulfport Energy Corporation Fixed Price Contracts 2009 25 |
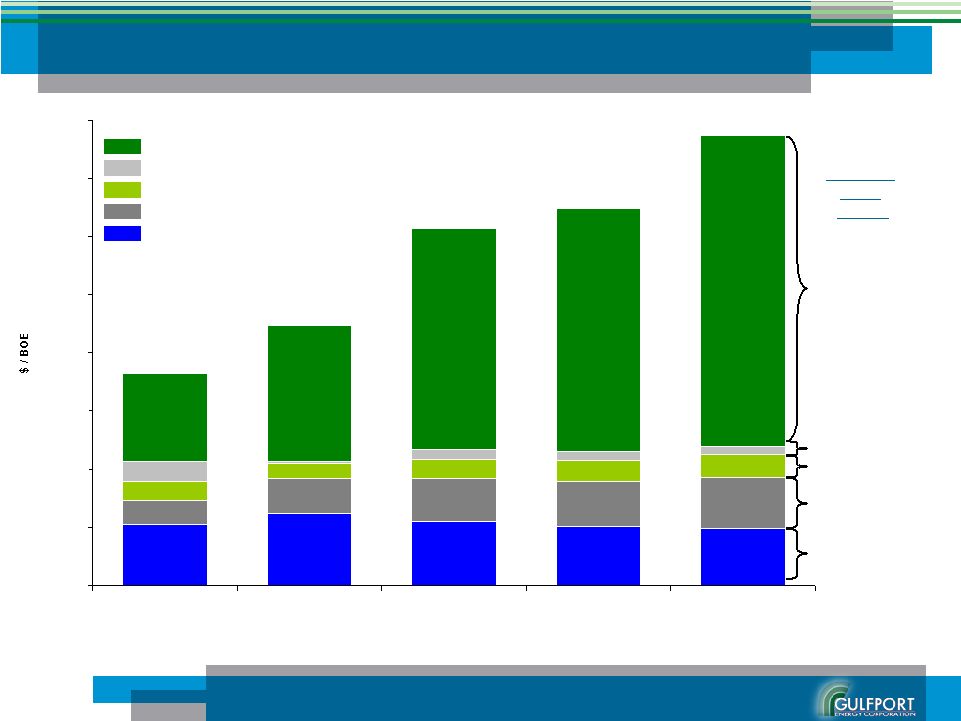 - 10.00 20.00 30.00 40.00 50.00 60.00 70.00 80.00 2004 2005 2006 2007 1H2008 Net cash margin Interest expense G&A Production Tax Lease Operating Expense Net Interest Exp: $1.43 G&A: $4.06 Production Taxes: $8.56 LOE: $9.85 Realized Price $77.37 1H2008 Averages (per boe) 1H2008 Net Cash Margin: $53.47 Expanding Cash Margins Expanding Cash Margins 26 |
 Compelling Portfolio Compelling Portfolio Low-risk cash generation through developmental drilling in S. Louisiana and now the Permian Basin Activity commencing in the Bakken, one of North America’s hottest plays Canadian Oil Sands investment adds substantial upside value Conservative financial structure with hedges in place to secure cash flow Production and reserve mixes are heavily oil-weighted Asset portfolio provides great diversity, providing exposure to multiple rich
oil plays 27 |
 Corporate Information Corporate Information Gulfport Energy Headquarters: 14313 N. May Ave, Suite 100 Oklahoma City, OK 73134 Contact: Michael G. Moore Vice President & Chief Financial Officer (405) 848-8807 Paul K. Heerwagen Investor Relations (405) 242-4888 www.gulfportenergy.com Common Stock – NASDAQ: GPOR 28 |