 Gulfport Energy Corporation Gulfport Energy Corporation IPAA OGIS San Francisco IPAA OGIS San Francisco September 29, 2009 September 29, 2009 Exhibit 99.1 |
| Gulfport Energy Corporation Gulfport Energy Corporation IPAA OGIS San Francisco IPAA OGIS San Francisco September 29, 2009 September 29, 2009 Exhibit 99.1 |
 Forward-Looking Statement Forward-Looking Statement 1 This presentation includes “forward-looking statements” within the meaning of Section 27A of
the Securities Act of 1933, as amended (the “Securities Act”), and Section 21E of the
Securities Exchange Act of 1934, as amended (the “Exchange Act”). All statements,
other than statements of historical facts, included in this presentation that address
activities, events or developments that Gulfport expects or anticipates will or may occur in the
future, including such things as future capital expenditures (including the amount and nature
thereof), business strategy and measures to implement strategy, competitive strength, goals,
expansion and growth of Gulfport’s business and operations, plans, market conditions,
references to future success, reference to intentions as to future matters and other such
matters are forward-looking statements. These statements are based on certain assumptions
and analyses made by Gulfport in light of its experience and its perception of historical
trends, current conditions and expected future developments as well as other factors it believes
are appropriate in the circumstances. However, whether actual results and developments will
conform with Gulfport’s expectations and predictions is subject to a number of risks and uncertainties, general economic, market, business or weather conditions; the opportunities (or lack
thereof) that may be presented to and pursued by Gulfport; competitive actions by other oil and
gas companies; changes in laws or regulations; and other factors, many of which are beyond the
control of Gulfport. Information concerning these and other factors can be found in the
company’s filings with the Securities and Exchange Commission, including its Forms
10-K, 10-Q and 8-K. Consequently, all of the forward-looking statements made in
this presentation are qualified by these cautionary statements and there can be no assurances
that the actual results or developments anticipated by Gulfport will be realized, or even if
realized, that they will have the expected consequences to or effects on Gulfport, its business
or operations. We have no intention, and disclaim any obligation, to update or revise any
forward-looking statements, whether as a result of new information, future results or
otherwise. |
 Gulfport Today Gulfport Today Southern Louisiana Acreage: 13,493 Net Acres Reserves: 16.259 MMBoe Permian Basin Acreage: 6,437 Net Acres Reserves: 8.395 MMBoe Bakken Shale Acreage: 6,740 Net Acres Canadian Oil Sands Acreage: 127,941 Net Acres Thailand Acreage: 4,000,000 Gross Acres Reserves: 3.5 Net Bcf Gas 19,000 Net Bbls Oil Ticker: Market Cap 1 : $362 MM 42.67 MM Shares x $8.48 Per Share Enterprise Value 1 : $420 MM Map of Operations Portfolio Highlights • 25.5 MMBOE Net Proved Reserves at YE’08 – Forecasted YE’09 Reserves of ~25.5 MMBOE 2 – 15-Year Reserves to Production Ratio • 2009 Forecasted Production of 1.65 to 1.75 MMBOE – Estimate 1.19 MMBOE produced through 9/20/09 – Approximately 97% Oil & Liquids Company Overview ¹ Calculated as of the close of the market on 9/26/09 at a price of $8.48 per share using
2Q’09 shares outstanding, short-term and long-term debt, and
cash and cash equivalents from the company’s second quarter 2009 financial statements ² 2009 internal reserve estimates based upon current strip pricing held constant and not
new SEC pricing regulations • ~250 Net Identified Drilling Locations² • Position in the Canadian Oil Sands Provides Upside Beyond Proved Reserves 2 |
 Key
Investment Considerations Key Investment Considerations OIL Growth Gulfport has a diverse portfolio of oil-weighted assets Active in Southern Louisiana and the Permian, two of America’s most prolific oil producing basins Long-term leases in the Canadian Oil Sands provide long-term optionallity in the largest oil play in the world outside Saudi Arabia Approximately 97% oil and liquids weighted production profile Gulfport’s large captured resource and high rate of return opportunities drive visible growth for the foreseeable future Multi-year drilling inventory exploitable from within cash flow First oil sands project projected to come online in 2012, with each subsequent project bringing the potential for significant reserve and production growth Track record of opportunistic acquisitions provides additional upside 3 |
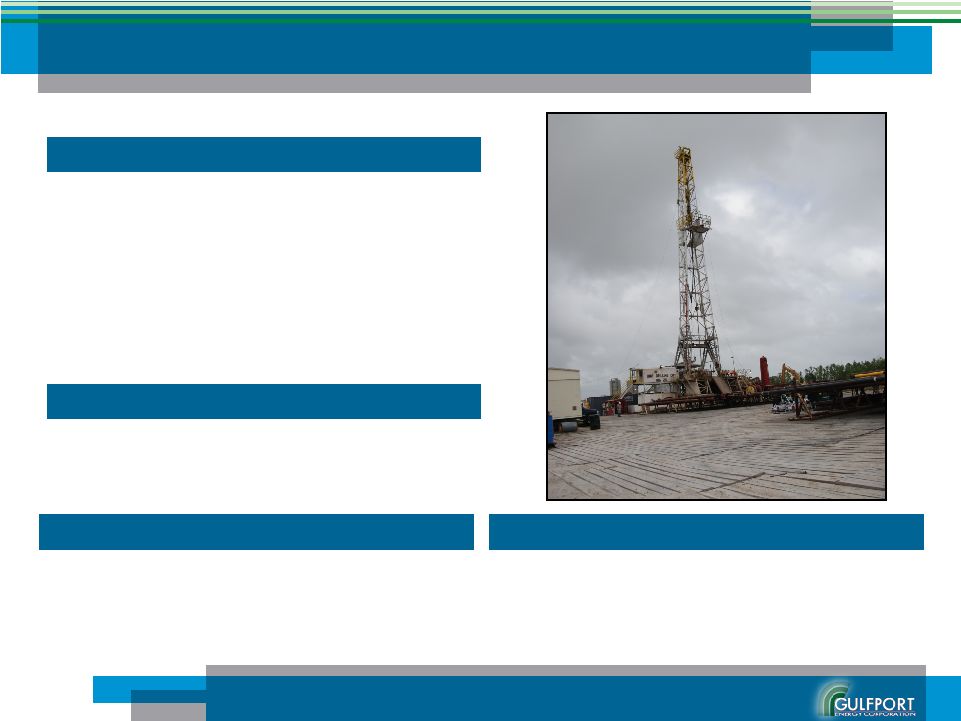
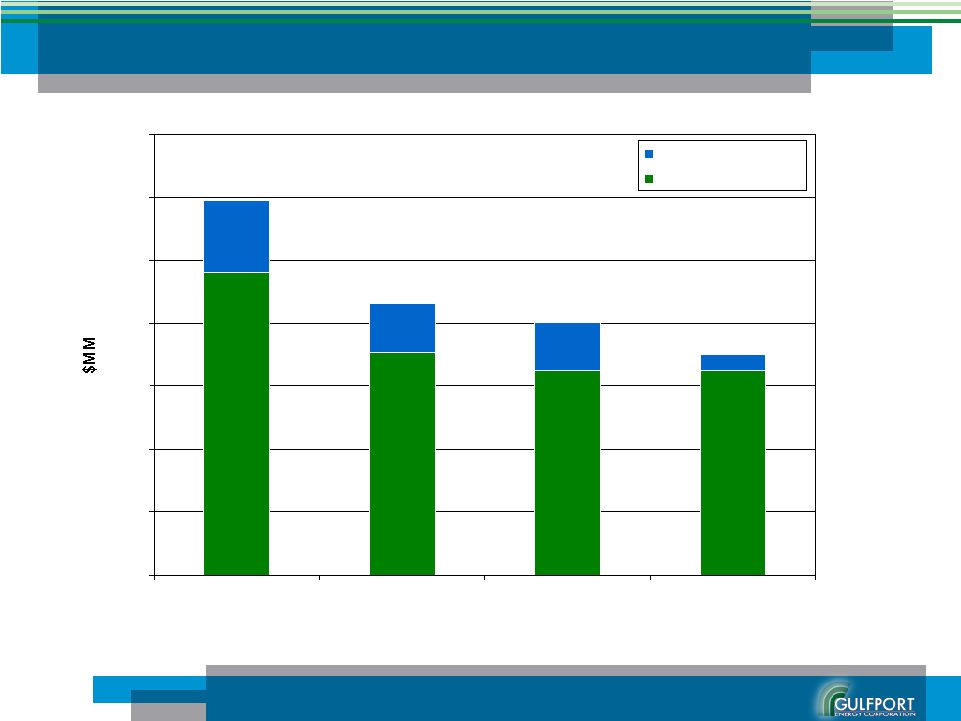 Balance Sheet Balance Sheet Declining Levels of Debt & Liabilities 41% reduction in debt & payables since 9/30/08 achieved through a combination of asset sales and drilling reduction 4 $95.9 $70.7 $65.0 $64.8 $23.2 $15.3 $15.4 $5.3 $0 $20 $40 $60 $80 $100 $120 $140 09/30/08 12/31/08 3/31/09 6/30/2009 Accounts Payable ST & LT Debt $119.1 $86.0 $80.4 $70.1 |
 Not
only have costs been reduced, but access to quality crews and labor has also
dramatically improved, reducing the risk for potential cost overruns Cost
Environment Cost Environment The combined effect of increased commodity pricing and reduced drilling and completion costs has allowed Gulfport to resume drilling in earnest again 5 % Decrease Mobilization/Demobilization 10,000 $ per job 35,000 $ per job -71% Drilling Costs-Daywork 19,000 $ per day 34,000 $ per day -44% Marine Services, Tugs 3,300 $ per day 5,200 $ per day -37% Directional Services 6,000 $ per day 18,000 $ per day -67% Cement & Cementing Services 60,000 $ per job 100,000 $ per job -40% Completion Rig & Swab Unit 12,000 $ per day 17,500 $ per day -31% 9 5 / 8 Surface Casing 19.50 $ per foot 44.00 $ per foot -56% 5½ Production Casing 10.60 $ per foot 23.00 $ per foot -54% SL340 #989 SL340 #981 (June 2009) (October 2008) |
 Valuing Gulfport Valuing Gulfport At year-end 2007 Gulfport’s PV-10 value was $821 MM based on a price deck of $92.50 per barrel WTI and 6.80 per MCF Henry Hub As of mid-year 2009 Gulfport’s estimates it’s PV-10 value to have increased to ~$515 MM¹ based on the current strip of $75.00 per barrel WTI and $5.35 per MCF Henry Hub $126 MM Due to price revisions at year-end 2008, Gulfport lost 3.0 MMBOE of proved reserves causing its PV-10 value to be reduced to $126 MM based on a price deck of $41.00 per barrel WTI and $5.71 per MCF Henry Hub Oil sands provide significant upside and are completely discounted from enterprise valuation Gulfport is highly leveraged to oil and is presently trading at a discount to its current PV-10 value which assigns no value to its position in the Canadian Oil Sands Year-End 2007 Year-End 2008 Mid-Year 2009 Projected First Production 2012 6 Gulfport’s Oil Sands Cost Basis Totals ~$40 MM ¹ 2009 internal reserve estimates based upon current strip pricing held constant and not
new SEC pricing regulations |
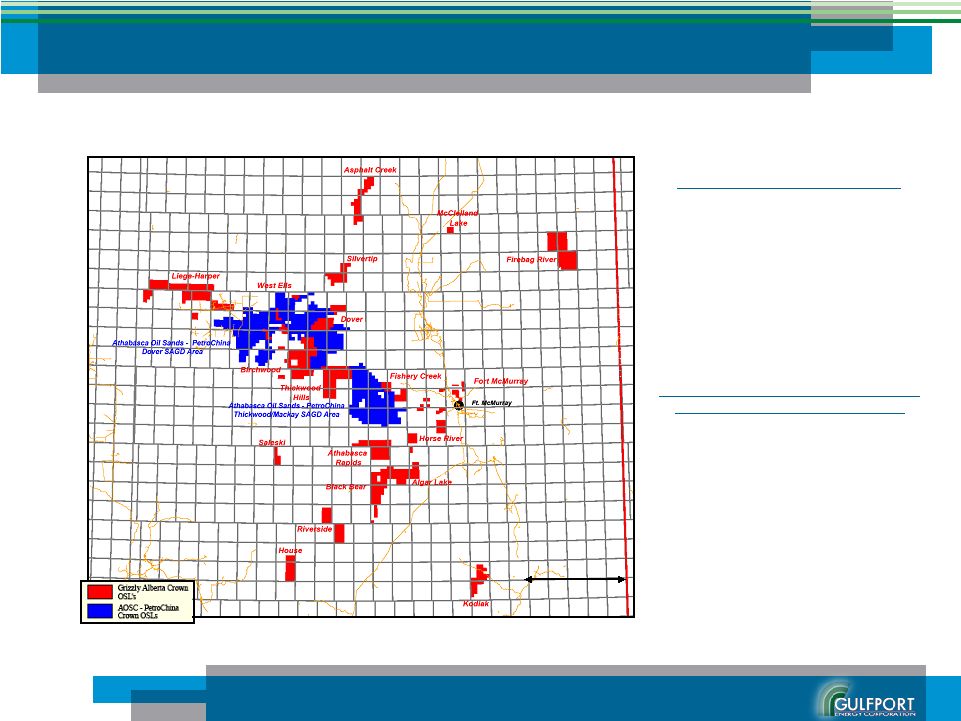
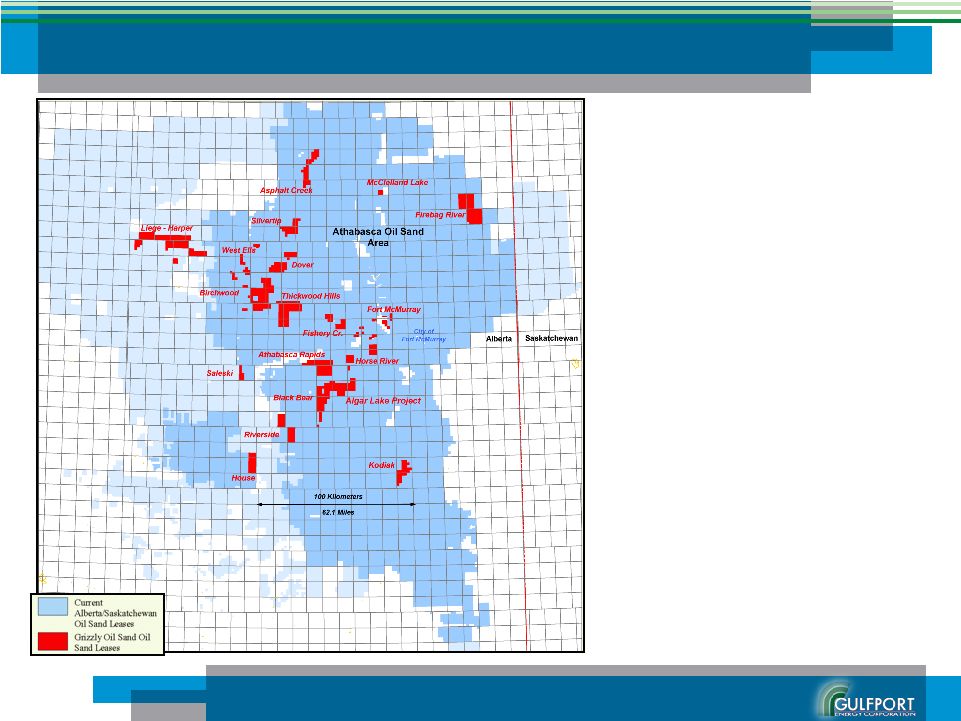 • Gulfport holds an interest in approximately 127,941 net acres¹ of oil sands leases • The Canadian oil sands of Alberta are the world’s largest oil play outside of Saudi Arabia with approximately 173 billion² barrels of oil proven to be recoverable using today’s technology • The Athabasca region of the Canadian oil sands play totals 10.4 MM acres and Gulfport’s acreage¹ represents approximately 1% of the play Gulfport in the Scope of Canada’s Oil Sands Gulfport in the Scope of Canada’s Oil Sands 7 ¹ Gulfport’s position in the Canadian Oil Sands comes by way of its 24.9999% interest
in Grizzly Oil Sands, ULC ² http://oilsands.alberta.ca/519.cfm |
 AOSC
– PetroChina Deal Provides Additional Valuation Metrics for Gulfport’s Acreage² • On August 31, 2009 Athabasca Oil Sands Crop (AOSC) and PetroChina announced a deal whereby PetroChina will acquire 60% of AOSC’s Dover and MacKay River oil sands projects AOSC – PetroChina Deal 180,000 Net Acres @ $9,650 Per Acre = $1.74 Billion NO PRODUCTION Canadian Oil Sands Acreage Net to Gulfport’s Interest 127,941 Acres² A large portion of Gulfport’s acreage² is located directly adjacent or surrounding to the acreage included in the AOSC – PetroChina deal Unlocking Value in the Canadian Oil Sands Unlocking Value in the Canadian Oil Sands ¹ AOSC – PetroChina acreage shown on map depicts only acreage included in the August 31, 2009 transaction and
is only a portion of AOSC’s overall acreage in the Canadian oil sands. ² Gulfport’s position in the Canadian Oil Sands comes by way of its 24.9999% interest
in Grizzly Oil Sands, ULC 8 50 Kilometers 31.1 Miles 1 |
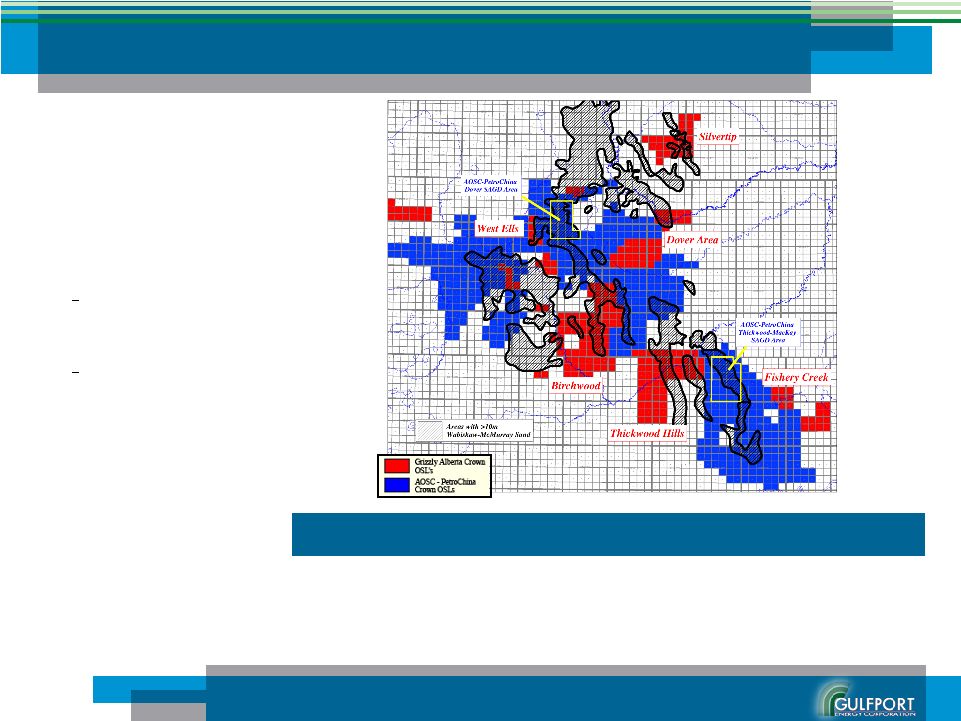 Unlocking Value in the Canadian Oil Sands (cont.) Unlocking Value in the Canadian Oil Sands (cont.) • ~50,000 acres net to Gulfport’s interest 1 are located in the direct vicinity of the AOSC – PetroChina acreage • This portion of acreage has well control from: ~278 wells on or within 1 section of the acreage ~578 wells on or within 3 sections of the acreage • Internal estimates³ of original oil in place on its acreage in direct vicinity of the AOSC- PetroChina acreage represents 19% of the net original oil in place sold in the AOSC- Petrochina deal ¹ Gulfport’s position in the Canadian Oil Sands comes by way of its 24.9999% interest
in Grizzly Oil Sands, ULC ² AOSC – PetroChina acreage shown on map depicts only acreage included in the August 31, 2009
transaction ³ Grizzly’s internal estimate of OOIP net to the AOSC-PetroChina 60% joint venture and Gulfport’s 24.9999% proportionate interest. Isopach map and OOIP estimates are the products of Grizzly’s internally generated estimates
and assumptions 9 1,2,3 AOSC - PetroChina Acreage Gulfport Acreage In Direct Vicinity Net Lease Bonuses 2 ~C$111 MM ~C$16 MM Gross Core Holes Drilled by Operator 267 Core Holes 55 Core Holes Gross Existing Well Control on Acreage 140 Wells 100 Wells Internal Estimate of Net Original Oil In Place 3 ~ 3.90 Billion Bbls ~ 0.73 Billion Bbls $/Acre from Precedent AOSC-PetroChina Trasnaction Acreage Value $1.7 Billion $483 Million $9,650 |
 Canadian Oil Sands Historical M&A Canadian Oil Sands Historical M&A 10 Announcement Transaction Working Interest Transaction Acquiror Seller Target Date Value Lease Size Value US$mm Acres $/acre Pettrochina Athabasca Oil Sands 60% of Company 8/31/2009 $1,737 180,000 $9,650 Nexen OPTI Canada 15% Long Lake 12/17/2008 $735 38,880 $18,904 & Future Developments Occidental Petroleum Enerplus Resources 15% Joslyn Project 6/23/2008 $500 n/a n/a Total Synenco Synenco 4/28/2008 $381 50,100 $7,605 B.P. Husky Sunrise J.V. 12/5/2007 $1,163 42,000 $27,679 Petro Canada / UTS Energy 10% of Ft. Hills 9/19/2007 $740 5,982 $123,709 Teck Cominco Marathon Western Oil Sands Company 7/31/2007 $6,200 73,561 $84,284 MEG Paramount Surmont 5/31/2007 $281 7,680 $36,536 Petrobank Minority Owner 16% Whitesands stake 5/14/2007 $108 6,349 $16,980 Statoil NAOSC Company 4/26/2007 $2,000 257,200 $7,776 Teck Cominco UTS Energy 50% of Lease 14 4/19/2007 $177 3,574 $49,559 Enerplus Kirby Oil Sands Partnership 90% of Company 3/22/2007 $158 39,024 $4,041 Conoco Encana Christina Lake/Foster 10/5/2006 $2,800 380,000 $7,368 Phillips Creek J.V. KNOC Newmont BlackGold 7/24/2006 $270 9,600 $28,125 Shell Canada BlackRock Ventures Company 5/8/2006 $2,205 128,120 $17,212 TeckCominco UTS Energy 15% of Ft. Hills 9/6/2005 $358 6,926 $51,722 TotalFinaElf Deer Creek Company 8/2/2005 $1,256 46,771 $26,843 Sinopec Synenco 40% interest in NLP 5/31/2005 $120 18,211 $6,573 CNOOC MEG Energy 17% of Company 4/12/2005 $122 5,491 $22,145 Source: J.S. Herold, company reports and public disclosure |
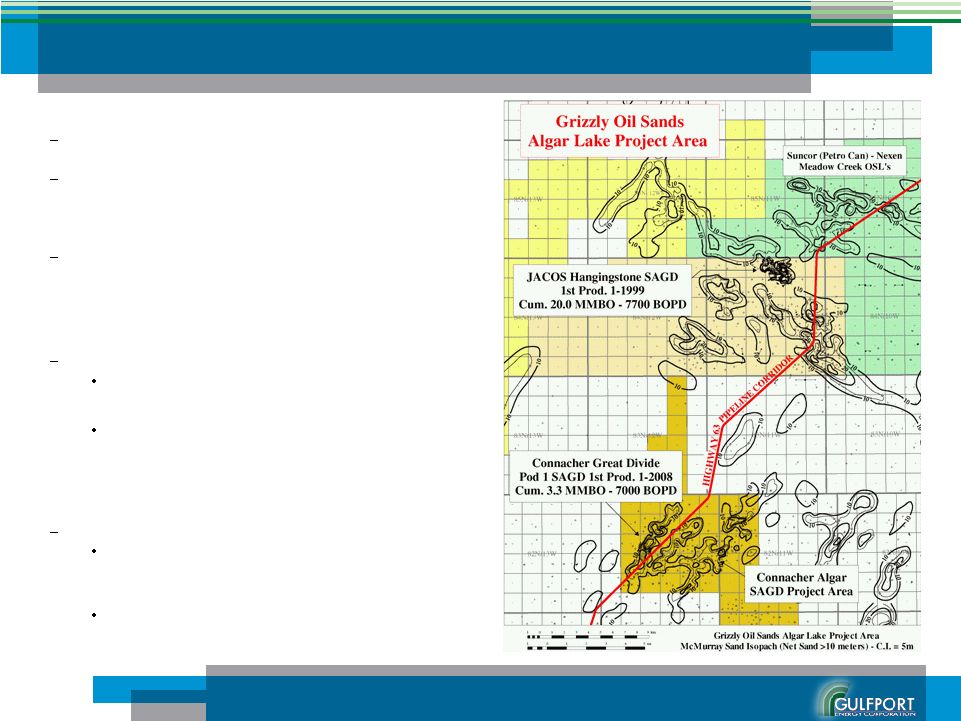 Algar Lake Project Algar Lake is expected to be the site of Grizzly’s¹ first oil sands production facility Grizzly¹ plans to develop Algar Lake employing a method of in-situ extraction called Steam Assisted Gravity Drainage (SAGD) to produce the leasehold Expected capital requirements and timing: • Anticipated capital cost of approximately C$100 million, or C$25 net to Gulfport, spread over a period of approximately 2 years • Expect to file regulatory application by year-end 2009 and first production by mid-to-late 2012 Production and resource potential for first phase: Production potential of approximately 1.8 million barrels per year, with approximately 0.45 million barrels net to Gulfport² Resource potential of approximately 50 to 100 million barrels per facility, with approximately 12.5 to 25 million barrels net to Gulfport² attributable to equity investment – Expect third-party report to confirm
estimates by year-end 2009 Why develop Algar Lake first? Low Geologic Risk – Will be developing the same type McMurray Channel sands as found in nearby JACOS & Connacher producing SAGD projects (Ave. Porosity: 33%, Ave Oil Saturation: 80%) Proximity to Infrastructure – Nearby access to the Highway 63 road and pipeline corridor. Existing natural gas and electric transmission lines within one mile of initial project area. Developing the Canadian Oil Sands Developing the Canadian Oil Sands 11 ¹ Gulfport owns a 24.9999% interest in Grizzly Oil Sands, ULC ² Gulfport’s position in the Canadian Oil Sands comes by way of its 24.9999% interest
in Grizzly Oil Sands, ULC ³ Isopach map is the products of Grizzly’s internally generated estimates and assumptions
|
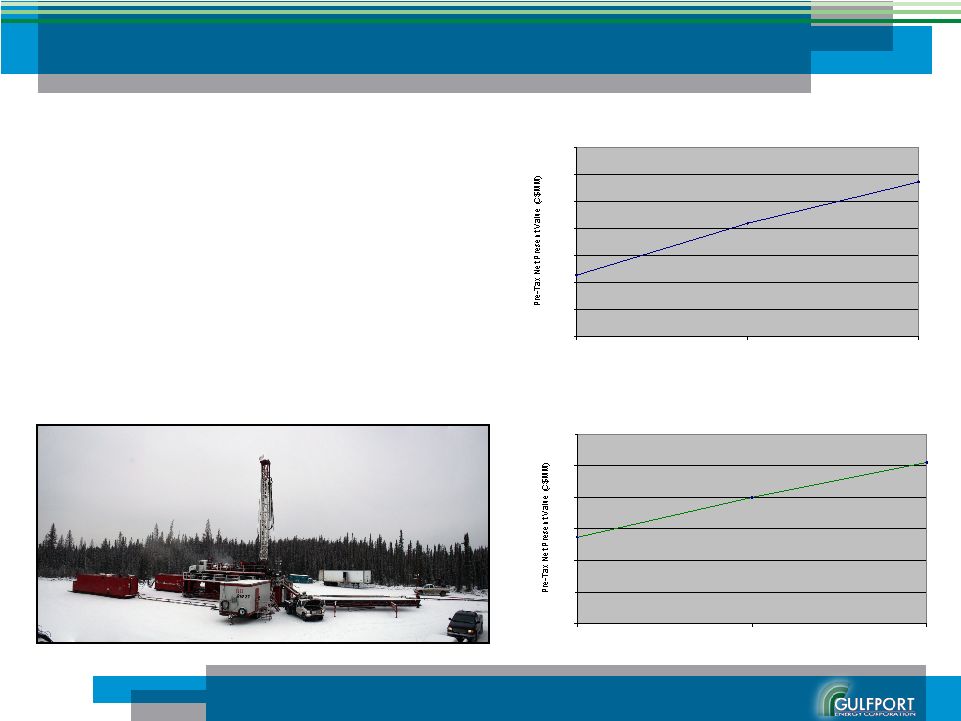 Canadian Oil Sands Economics Canadian Oil Sands Economics Generic SAGD Facility Economics¹ Assumptions WTI / NYMEX Gas Ratio 15-to-1 AECO Gas as % of Henry Hub 90% Wellhead Bitumen Price as % of WTI 70% Nameplate Production Capacity 5,000 Bbls/d Total CAPEX C$ 100 - 125 MM Gas Consumption 1.6 Mcf/Bbl Annual Non-Fuel Operating Cost C$ 10 MM Annual Maintenance CAPEX C$ 4 MM Total Estimated Recovery 50 - 100 MMBbls Pre-Tax Net Present Value Sensitivities to the Gross 100% Working Interest for First Phase SAGD Project $114 $286 $209 $- $50 $100 $150 $200 $250 $300 $350 $50 $75 $100 West Texas Intermediate (US$/BBL) Pre-Tax Internal Rate of Return Sensitivities to the Gross 100% Working Interest for First Phase SAGD Project 27% 51% 40% 0% 10% 20% 30% 40% 50% 60% $50 $75 $100 West Texas Intermediate (US$/BBL) 12 ¹ Internal estimates |
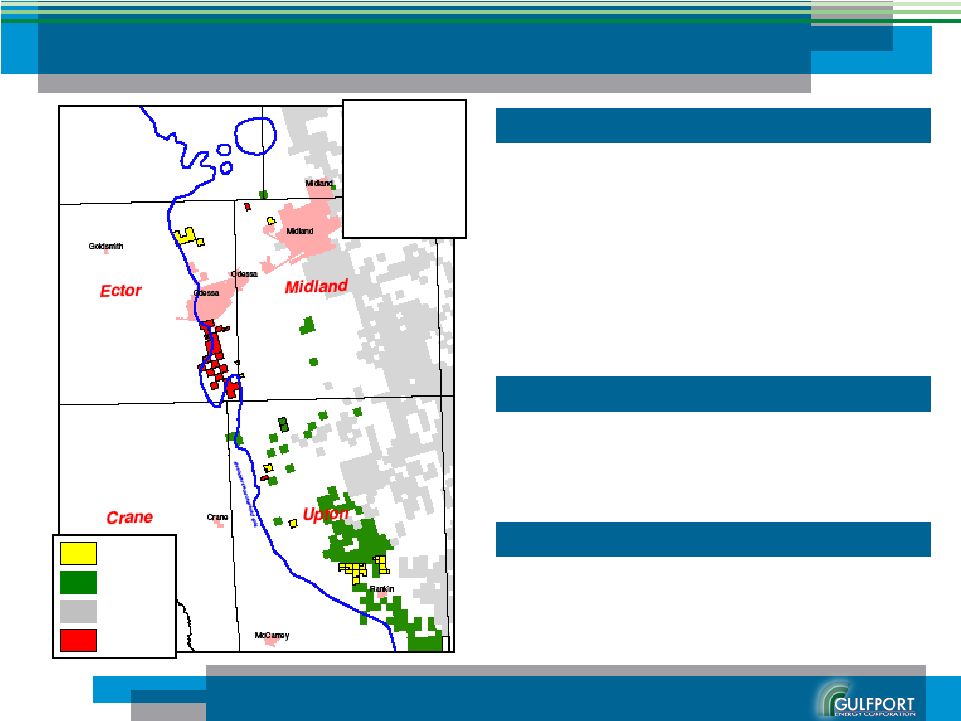 Permian Basin Permian Basin • Currently hold 6,437 net acres after acquiring an additional 2,127 net acres located north of Gulfport’s existing acreage and west of the city of Midland • Currently shooting seismic on recently acquired acreage • Have identified approximately ten net wells with up-hole opportunities that could potentially add incremental production • Gulfport plans to drill approximately one net well in the Permian during 2009 • Net proved reserves of 8.40 MMBOE – 100% third party engineered • 6,437 net acres and 128 net identified future drilling locations on 40-acre units 2009 Activity Update • Average net production of 619 BOEPD • Produces approximately 15% of Gulfport’s total net production • 82% oil and NGL weighted production mix Inventory¹ Production² ¹ 12/31/08 ² Three months ended 6/30/09 ³CXO: 140-150 MBOE Gross (Q2’09 Earnings Call); PXD: 120-150 MBOE
Gross (September 2009 Presentation, Pg. 22); DVN: 150 MBOE Gross (Q2’09
Earnings Call) GPOR Leasehold Concho Leasehold Pioneer Leasehold 13 Devon Leasehold Gross Estimated Ultimate Recovery GPOR: 110-145 MBOE Peers CXO: 140-150 MBOE PXD: 120-150 MBOE DVN: 150 MBOE 3 |
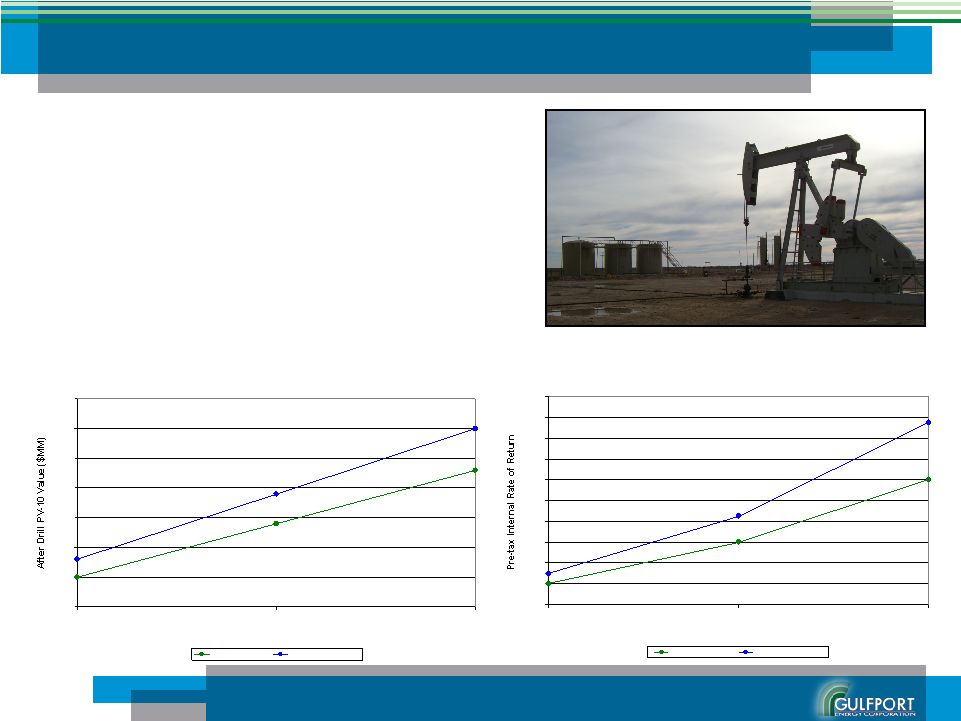 Permian Basin Permian Basin Generic Wolfberry Well Economics After Drill PV-10 Value Sensitivities $3.3 $2.4 $1.5 $1.8 $4.0 $2.9 $1.0 $1.5 $2.0 $2.5 $3.0 $3.5 $4.0 $4.5 $50 $75 $100 West Texas Intermediate ($/BBL) 90 MBOE Net EUR 110,000 BOE Net EUR Reserves Net Reserves¹ 90,000 - 110,000 BOE Oil 64% Gas & NGLs 36% Drill & Complete Cost $ 1.2 MM WTI / NYMEX Gas Ratio 15-to-1 14 ¹ Permian Peer Gross EUR’s: CXO: 140-150 MBOE; PXP: 120-130 MBOE; DVN: 150
MBOE Internal Rate of Return Sensitivities 20% 120% 60% 30% 85% 175% 0% 20% 40% 60% 80% 100% 120% 140% 160% 180% 200% $50 $75 $100 West Texas Intermediate ($/BBL) 90,000 BOE Net EUR 110,000 BOE Net EUR |
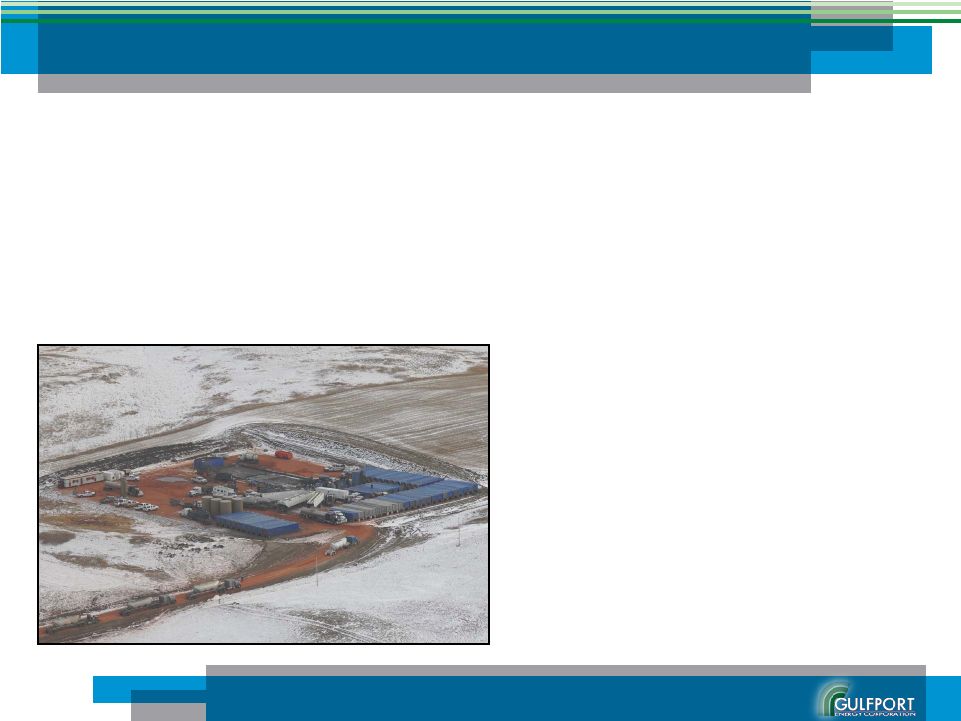
 West Cote Blanche Bay West Cote Blanche Bay • Began 2009 drilling program on June 5 th • Plan to drill approximately 8 to 10 wells at West Cote during 2009 • Net proved reserves of 13.40 MMBOE – 100% third party engineered • Estimated YE’09 Reserves of 13.58 MMBOE³ 2009 Activity Update • Average net production of 3,052 BOEPD • Produces approximately 72% of Gulfport’s total net production • ~100% oil weighted production mix – Priced as high quality HLS crude and sold at a premium to WTI Inventory¹ Production² • Capital cost of approximately $1.39 MM • Internal Rate of Return – 55% ($65.00 Oil, $4.00 Gas) – 78% ($75.00 Oil, $5.00 Gas) – >100% ($85.00 Oil, $6.00 Gas) Well Economics Deep prospective gas opportunities at West Cote Blanche Bay West Cote Blanche Bay Production Facilities ¹ 12/31/08 ² Three months ended 6/30/09 ³ 2009 internal reserve estimate 15 |
 Hackberry Hackberry • Entered into a joint exploration agreement covering approximately 3,058 net acres adjacent to the East Hackberry field – Represents a significant increase in footprint at Hackberry, growing Gulfport’s acreage position by approximately 39% • Plan to drill approximately 4 wells at Hackberry during 2009 • Proved reserves of 2.86 MMBOE • 13 preliminarily permitted drilling locations • Proprietary 42 square mile 3-D seismic survey shot in 2005 2009 Activity Update • Average net production of 539 BOEPD • Produces approximately 13% of Gulfport’s total net production • 94% oil weighted production mix Inventory¹ Production² • Capital cost of approximately $1.45 MM per well Well Cost ¹ 12/31/08 ² Three months ended 6/30/09 16 |
 Appendix 17 |
 Hedged Production Hedged Production Month Weighted Average Daily Price Barrels Per Day July-09 $55.17 3,000 August-09 $55.17 3,000 September-09 $54.81 3,000 October-09 $54.81 3,000 November-09 $54.81 3,000 December-09 $54.81 3,000 Gulfport Energy Corporation Fixed Price Contracts¹ 2009 Month Weighted Average Daily Price Barrels Per Day January-10 $54.81 3,000 February-10 $54.81 3,000 March-10 $58.24 2,300 April-10 $58.24 2,300 May-10 $58.24 2,300 June-10 $58.24 2,300 July-10 $58.24 2,300 August-10 $58.24 2,300 September-10 $58.24 2,300 October-10 $58.24 2,300 November-10 $58.24 2,300 December-10 $58.24 2,300 Gulfport Energy Corporation Fixed Price Contracts¹ 2010 ¹ Hedges structured as physical contracts in place directly with Gulfport’s crude oil
purchaser ² Hedges marked-to-market based upon 9/25/09 strip pricing Q1 Q2 Q3 Q4 Total 2010 Fixed Price Contracts Volume (Bbl) - 273,000 276,000 276,000 825,000 880,800 Weighted Average Price (Bbl) - $ 55.17 $ 55.05 $ 54.81 $ 55.01 $ 57.55 $ 2009 18 Hedges represent a potential mark-to-market hedging loss of
approximately $14.7 million¹ |
 Bakken Shale Bakken Shale • Located in Montana, North Dakota, South Dakota and Saskatchewan, the Bakken formation covers over 200,000 square miles of the subsurface of the Williston Basin – In April 2008, the USGS released a report estimating there to be 3.0 to 4.3 billion barrels of undiscovered, technically recoverable oil in the Bakken formation • Based upon the identified geologic trends, Gulfport began actively pursuing acreage early in the play’s development, effectively achieving first mover advantages • New technology is key to field development – Extensive vertical faulting combined with the application of horizontal drilling techniques and advancements in fracturing technology have helped drive development • Bakken Shale – 6,740 net acres – Future wells will target an average total measured depth of ~14,500’ • In May 2009, Gulfport monetized 12,270 net acres of its shorter-term leases in the Bakken for $13.0 million – Currently hold 6,740 net acres, interests in 4 gross wells, and up to a 7.5% ORRI in the acreage sold, proportionately reduced to Gulfport’s ownership interest after delivering 80% NRI to the purchaser 19 |
 Thailand Thailand Through an indirect equity investment in APICO, Gulfport has gained exposure to a natural gas play in northeast Thailand Third party engineers Gaffney Cline credit wells producing in the Phu Horm gas field with approximately ½ TCF¹ of reserves Net to Gulfport’s interest, total proved reserves are estimated to be 3.5 Bcf of natural gas and 19,000 barrels of oil Exploratory potential of four concession blocks totaling approximately 4 MM acres provides significant upside APICO has identified several high-quality exploration targets ¹ Third party report issued on 12/31/07 Shoot a 3-D seismic survey of Blocks L27/43 and L16/50 (shown as the lower brown and yellow blocks on the map) Gross production in the Phu Horm gas field, of which Gulfport indirectly owns 0.7%, averaged 83 MMcf per day of natural gas and 433 Bbls per day of oil in 2008 Long-term gas sales contract in place with Thai government in place, locking in favorable pricing Pricing tied to Singapore Medium Sulfur Fuel Oil (MSFO 20 |